

Value-focused investors are always on the hunt for stocks that are priced below their intrinsic value. One such stock that merits attention is NIO Inc (NIO, Financial). The stock, which is currently priced at 9.15, recorded a loss of 11.3% in a day and a 3-month increase of 1.15%. The stock's fair valuation is $29.67, as indicated by its GF Value.
Understanding the GF Value
The GF Value represents the current intrinsic value of a stock derived from our exclusive method. The GF Value Line on our summary page gives an overview of the fair value that the stock should be traded at. It is calculated based on three factors: historical multiples (PE Ratio, PS Ratio, PB Ratio, and Price-to-Free-Cash-Flow) that the stock has traded at, GuruFocus adjustment factor based on the company's past returns and growth, and future estimates of the business performance.

However, investors need to consider a more in-depth analysis before making an investment decision. Despite its seemingly attractive valuation, certain risk factors associated with NIO should not be ignored. These risks are primarily reflected through its low Piotroski F-score of 2, and Altman Z-score of 0.93. These indicators suggest that NIO, despite its apparent undervaluation, might be a potential value trap. This complexity underlines the importance of thorough due diligence in investment decision-making.
Decoding Piotroski F-Score and Altman Z-Score
The Piotroski F-score, created by accounting professor Joseph Piotroski, is a tool used to assess the strength of a company's financial health. The score is based on nine criteria that fall into three categories: profitability, leverage/liquidity/ source of funds, and operating efficiency. The overall score ranges from 0 to 9, with higher scores indicating healthier financials. NIO's current Piotroski F-Score, however, falls in the lower end of this spectrum, indicating potential red flags for investors.
Before delving into the details, let's understand what the Altman Z-score entails. Invented by New York University Professor Edward I. Altman in 1968, the Z-Score is a financial model that predicts the probability of a company entering bankruptcy within a two-year time frame. The Altman Z-Score combines five different financial ratios, each weighted to create a final score. A score below 1.8 suggests a high likelihood of financial distress, while a score above 3 indicates a low risk.
A Closer Look at NIO Inc (NIO, Financial)
Founded in November 2014, NIO designs, develops, jointly manufactures, and sells premium smart electric vehicles. The company differentiates itself through continuous technological breakthroughs and innovations such as battery swapping and autonomous driving technologies. Nio launched the first model, its ES8 seven-seater electric SUV in December 2017, and began deliveries in June 2018. Its current model portfolio includes midsize to large sedans and SUVs. It sold over 122,000 EVs in 2022, accounting for about 2% of the China passenger new energy vehicle market.

Analysis of NIO's Profitability
Firstly, let's address profitability. One significant component of the F-Score is a positive return on assets (ROA). A closer look at NIO's ROA reveals a worrying trend of negative returns. This indicates the company's inability to generate profit from its assets - a fundamental concern for any investor.
Leverage, Liquidity, and Source of Funds: A Worrying Trend
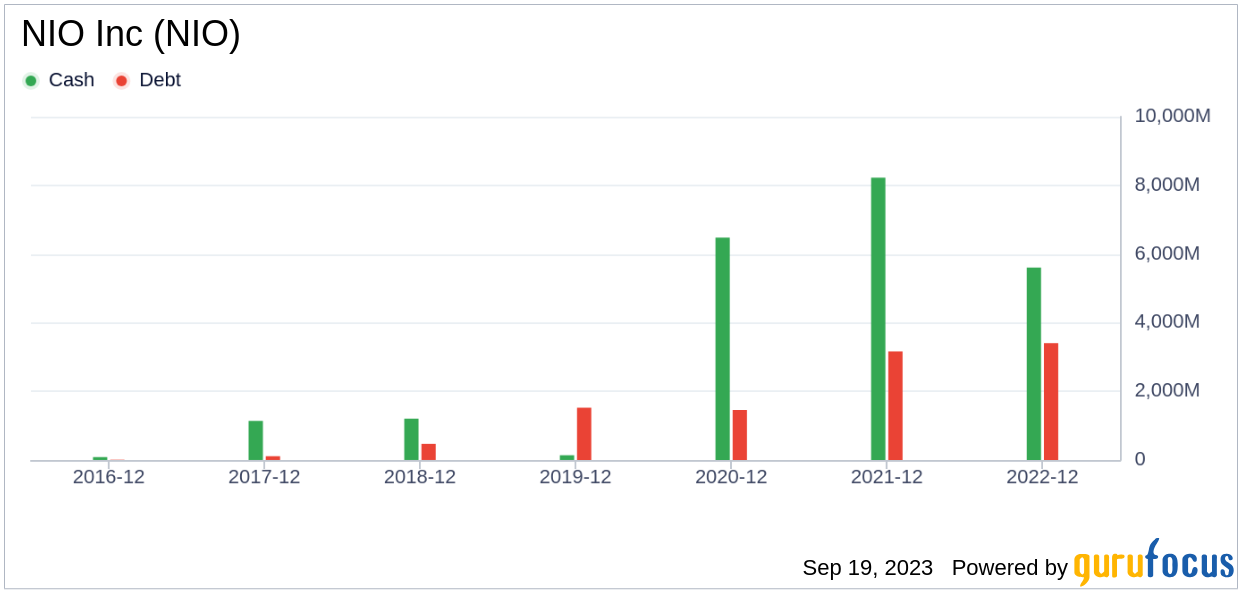
Examining NIO's financial stability, there's a notable decrease in its current ratio over the past three years, as shown by the data 2021: 2.48; 2022: 1.87; 2023: 1, which is expressed as percentages. The current ratio is a key indicator of a company's short-term financial health, as it gauges the ability to cover short-term liabilities with short-term assets. A declining current ratio suggests that NIO's liquidity and capability to manage immediate financial obligations are deteriorating.
Operating Efficiency: A Darker Picture
Examining the data provided: 2021: 1,563.89; 2022: 1,632.80; 2023: 1,652.86, it becomes evident that NIO has seen an increase in its Diluted Average Shares Outstanding over the past three years. This trend signals that the company has issued more shares. While issuing additional shares can provide immediate capital for the business, it can also lead to the dilution of existing shares' value. This dilution occurs because the earnings of the company now have to be divided among a larger pool of shares, which could decrease Earnings Per Share (EPS). Consequently, if the company's earnings don't grow at a pace that matches or exceeds this share increase, it could lead to a reduction in the value perceived by existing shareholders, potentially impacting their investment returns. Hence, while additional share issuance may provide necessary capital, it is important to monitor its impact on shareholder value carefully.
In terms of operational efficiency, another key indicator, NIO has unfortunately reported a declining trend in asset turnover over the past three years, as evidenced by the data: 2021: 0.58; 2022: 0.50; 2023: 0.52 (expressed in percentages). Asset turnover measures how effectively a company uses its assets to generate sales, and a decrease in this ratio can indicate a drop in efficiency. This could be due to various factors, such as underutilization of assets or a decline in the market demand for the company's products or services. Consequently, this downward trend in asset turnover implies that NIO may need to revisit its operational strategies to improve the utilization of its assets and boost its sales volume.
NIO's Low Altman Z-Score: A Breakdown of Key Drivers
A dissection of NIO's Altman Z-score reveals NIO's financial health may be weak, suggesting possible financial distress. The EBIT to Total Assets ratio serves as a crucial barometer of a company's operational effectiveness, correlating earnings before interest and taxes (EBIT) to total assets. An analysis of NIO's EBIT to Total Assets ratio from historical data (2021: -0.04; 2022: -0.08; 2023: -0.24) indicates a recent dip following an initial rise. This reduction suggests that NIO might not be utilizing its assets to their full potential to generate operational profits, which could be negatively affecting the company's overall Z-score.
When it comes to operational efficiency, a vital indicator for NIO is its asset turnover. The data: 2021: 0.58; 2022: 0.50; 2023: 0.52 from the past three years suggests a decreasing trend in this ratio. The asset turnover ratio reflects how effectively a company is using its assets to generate sales. Therefore, a drop in this ratio can signify reduced operational efficiency, potentially due to underutilization of assets or decreased market demand for the company's products or services. This shift in NIO's asset turnover underlines the need for the company to reassess its operational strategies to optimize asset usage and boost sales.
Conclusion
While the Piotroski F-score is not the only lens through which to view a potential investment, it is a robust and comprehensive tool for evaluating a company's financial health. Unfortunately for NIO, its current score suggests potential troubles. These indicators, coupled with a low Altman Z-Score, suggest that NIO may be a potential value trap. Despite its seemingly attractive valuation, these risk factors should not be ignored. As always, thorough due diligence is crucial in investment decision-making.
GuruFocus Premium members can find stocks with high Piotroski F-score using the following Screener: Piotroski F-score screener .
GuruFocus Premium members can find stocks with high Altman Z-Score using the following Screener: Walter Schloss Screen .