
PR Newswire
PERTH, Australia, Sept. 13, 2024
Growth plan transitions Plutonic to new, virgin, ore sources
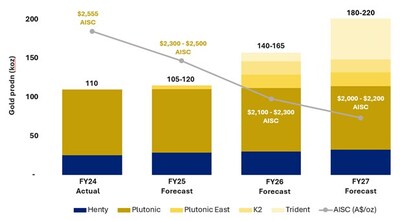
- A 105% growth in Reserves over the last 12-months has allowed Catalyst to provide three-year production guidance, increasing annual gold production from 100koz to 200koz
- Encouragingly, Catalyst's existing infrastructure enables this production growth for only A$31m
- The low capital intensity of this growth, allows Catalyst to commit greater funds to exploration in FY2025 – A$25m has been committed to exploration with the opportunity to allocate more should exploration results justify it
- After generating A$54m of free cash flow in FY2024, with cash and bullion today of A$44m, Catalyst is well placed to fund these plans over the coming 12 to 18 months
- Upon conclusion of the 18-month program, Plutonic plans to be mining four different virgin ore sources, feeding a single centralised processing plant
- In so doing, Catalyst intends to create a strong foundation for the Company's future, whether that be inorganic growth or exploration only on the Plutonic Gold Belt
PERTH, Australia, Sept. 13, 2024 /PRNewswire/ - Catalyst Metals Limited (Catalyst or the Company) (ASX: CYL) is pleased to provide its three-year production guidance and announce an update of its Group Ore Reserve Estimate (ORE).
Catalyst's Ore Reserves now total 1Moz of gold. Importantly, these Reserves provide the foundation for Catalyst's three-year production guidance, growing production from 100koz to 200koz.
The production growth to 200koz will come for total pre-production capital cost of A$31m. Importantly, it also transitions the Plutonic gold mine from a remnant mine to a new one.
This A$31m is spread across 18 months and three separate mine developments – Plutonic East, K2 and Trident. Each development will occur one after the other.
In addition, a A$25m exploration campaign is planned for FY2025. This includes a Resource drill out of each of the three deposits Plutonic East, K2 and Trident in an effort to extend their mine lives to five years and at annual gold production of greater than 20koz each. It also includes drilling out of each of the nine new in-mine areas at Plutonic and a A$7m 20,000m RC exploration program along two distinct corridors along the Plutonic belt – the Overthrust and Cinnamon corridors – designed to generate future Resource targets.
Catalyst's Managing Director and CEO, James Champion de Crespigny, said:
"Catalyst has today provided to the market its three-year growth plan which is underwritten by 1Moz of Reserves.
A year after consolidating the Plutonic Gold Belt, Catalyst has a strong balance sheet, stable operating cashflows and a pipeline of low-cost developments.
What is all the more exciting is the opportunity to now turn our attention to growth through exploration.
The Plutonic gold belt is an attractive exploration opportunity with the very real possibility of a significant discovery. The historically fractured and foreign ownership of Plutonic has led to a considerable lack of exploration along the belt. Furthermore, the fact it is a brownfields opportunity, without the need for Catalyst to go chasing potentially dilutive capital, is very exciting.
We plan to aggressively drill out and expand these three new mines – Plutonic East, K2 and Trident– well beyond their current life, along with dedicating the required capital to make further discoveries along the belt."
3-Year Production Guidance
Catalyst has updated and released multiple new Ore Reserves. In doing so, it has grown Ore Reserves to 1Moz in Reserves. These lay the foundation for Catalyst's production pathway to 200koz over the next three years.
Catalyst Three-Year Production and Cost Guidance
Guidance Range | FY2025 | FY2026 | FY2027 | |
Forecast | Forecast | Forecast | ||
Production | Koz | 105 – 120 | 140 – 165 | 180 – 200 |
Indicated % of production target | % | 94 % | 89 % | 88 % |
AISC | A$/oz | $2,300 – $2,500 | $2,100 – $2,300 | $2,000 – $2,200 |
Non-sustaining Operational Capital | A$M | 32 | 15 | 10 |
Total Growth Capital | A$M | 17 | 14 | TBA* |
Total Exploration Capital | A$M | >25 | TBA* | TBA* |
*Note: Exploration strategy evolving. Excess cashflow will inform future spend |
Production Guidance Commentary
FY2025:
Gold production in FY2025 is anticipated to be between 105koz to 120koz.
Production will be sourced from Plutonic Underground, Plutonic East and Henty mines.
K2 and Trident will be in the early stages of development with the refurbishment and establishment of the K2 underground, while it is planned for Trident's small open pit (or large box cut) to have commenced.
Exploration at in-mine proximal zones at Plutonic Underground will occur throughout the year with resulted reported intermittently. Results of drill outs of the satellite deposit K2 and Plutonic East will also be reported throughout the year.
Exploration is planned along the Overthrust and Cinnamon corridors with wide spaced drilling aimed at generating new targets for follow up programs in either FY25 or FY26 (result dependent). A focus will be on constructing the exploration team and building the team's understanding of the Plutonic Belt's mineralisation.
FY2026:
Gold production in FY2026 is anticipated to be between 145koz to 165koz.
Production will be sourced from each Plutonic Underground, Plutonic East, K2, Trident Open Pit and Henty. All Plutonic ores are to be processed through the existing and currently underutilised Plutonic Processing Plant.
It is planned that each of Plutonic Underground, Plutonic East, K2 and Henty operations will be running at steady state while Trident will be completing its open pit (large box cut) and transitioning to an underground operation. Ramp up to steady state operations at Trident is expected during the year.
Resource drill outs are expected to be completed during the year with a greater focus being placed on exploration.
The planned exploration program will be dependent on results received in FY25.
FY2027:
Gold production in FY2027 is anticipated to be between 180koz to 220koz.
Production will be sourced from each Plutonic Underground, Plutonic East, K2, Trident Underground and Henty. All Plutonic ores are to be processed through the existing processing plant with the mill reach full capacity during the year.
Trident production will be a more meaningful contributor, but will be operating below peak production levels. While not planned, production at Plutonic Underground is expected to be increasingly sourced from new zones possibly leading to additional gold production at lower cost.
Increased contribution from Plutonic East, K2 and Trident is expected to contribute to lower AISC as the benefits of scale across Plutonic's largely fixed cost base are realised.
Project development and exploration will be dependent on previous years exploration results however it is anticipated the Trident underground will begin to convert the current 250koz Inferred Resource into Reserve. Similar extensions are also anticipated from Plutonic East and K2.
Cautionary Statement: The 2025 Production Target contains approximately 94% of Ore Reserves and Indicated Resources with the remainder in the Inferred Mineral Resource classification. There is a low level of geological confidence associated with Inferred Mineral Resource and there is no certainty that further exploration work will result in the conversion to Indicated Mineral Resource or that the Production Target itself will be realised.
Reserve Growth
Catalyst has grown Reserves in the last 12 months by 105%. Included in this is Plutonic Underground's Reserve growth of 52%. A summary of Catalyst's Reserve growth over the last 12-months is below.
In the same way Reserves have expanded at Plutonic, Catalyst targets expanding Reserves at these newly announced Reserves of Plutonic East, Trident and K2. Catalyst has committed A$18m to achieve this over FY25.
With the development plan now in place for each of these Reserves, a dedicated Resource drill out program is being implemented.
Catalyst is planning Resource drill out programs in four areas:
- lutonic in-mine
- Plutonic East
- Trident
- K2
Successful drilling results from these programs are expected to increase Reserves and extend the mine life at these deposits.
Deposit | Reserve as at 30 | Depletion | Reserves at 30 | Reserve |
Plutonic | 490 | 85 | 616 | 52 % |
Trident | - | - | 188 | - |
Plutonic East | - | - | 36 | - |
K2 | - | - | 20 | - |
Henty | 115 | 25 | 154 | 71 % |
Total | 605 | 110 | 1,015 | 105 % |
Plutonic In-Mine
Plutonic underground has been running, uninterrupted, for 30 years. Coming with this history is +40 years of historical drilling data. Catalyst has analysed this data and identified nine areas where historical data suggests Plutonic gold mineralisation extends.
A$9m has been allocated in FY25 to drilling out these areas to a 15 x 15m drill spacing for the purpose of delineating additional Reserves and generating near term production areas.
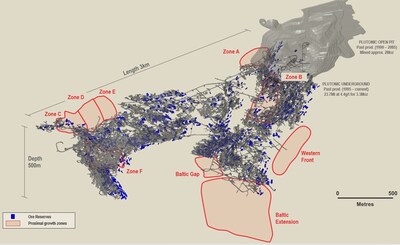
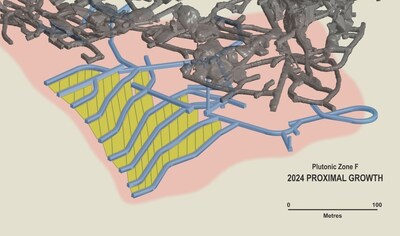
Zone F
The first area to be drilled is Zone F – see image 2 below.
The exploration target for this area is 30,000 to 45,000oz1. The cost to drill out this area to a 15m x 15m spacing is A$1.5m.
Initial results have been positive and Catalyst believes it has delineated a new mining area. Such a positive response is a good result from testing the first of these nine areas.
The Exploration Target has been prepared and reported in accordance with the 2012 edition of the JORC Code. The potential quantity and grade of the Exploration Target is conceptual in nature. There has been insufficient exploration to estimate a Mineral Resource. It is uncertain if further exploration will result in the estimation of a Mineral Resource.
_________________________________ |
1 The Exploration Target has been prepared and reported in accordance with the 2012 edition of the JORC Code. The potential quantity and grade of the Exploration Target is conceptual in nature. There has been insufficient exploration to estimate a Mineral Resource. It is uncertain if further exploration will result in the estimation of a Mineral Resource. |
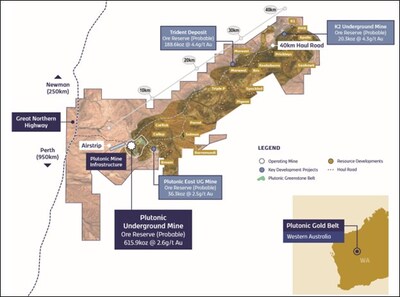
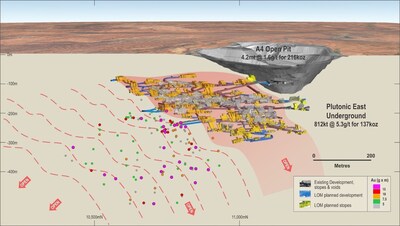
Plutonic East
Plutonic East has a mine plan of three years producing an average of 16koz annually. It lies 2km from the underutilised Plutonic processing plant.
In order to better establish Plutonic East, Catalyst's intention is to drill out the deposit targeting a five year mine life averaging +20koz of gold annually. The cost to achieve this is A$5m.
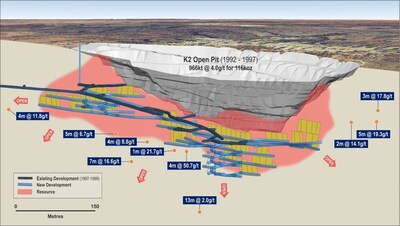
K2
K2 has a mine plan of three years producing an average of 18koz annually. It lies 40km from the underutilised Plutonic processing plant with an existing, well maintained, haul road, connecting the two.
In order to better establish K2, Catalyst's intention is to drill out the deposit targeting a five-year mine life averaging +20koz of gold annually. The cost to achieve this is A$4m.
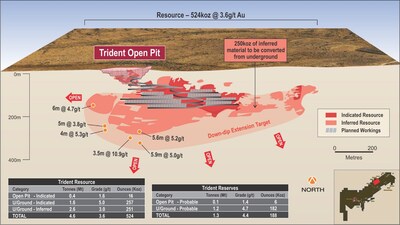
Trident
Trident has a plus five year mine plan producing an average of 37koz annually. It lies 2km from the underutilised Plutonic processing plant.
Trident already has an established mine life of 5 years. Further extensions can come from the 250koz of inferred Resources that have not been converted into Reserve due to a lack of drill density.
It is Catalyst's intention is to drill out extensions to Trident to increase the mine life beyond what is currently known. This drilling has commenced at a cost of A$1.6m spent across five diamond holes.
Plutonic Underground Ore Reserves
An Ore Reserve Estimation is the economically mineable part of a Measured and/or Indicated Mineral Resource. It includes diluting materials and allowances for losses, which may occur when the material is mined or extracted.
Following is a summary of the Plutonic Underground Ore Reserves, as at 01 July 2024.
Deposit | Proved | Probable | Total | ||||||
Tonnes | Grade | Gold | Tonnes | Grade | Gold | Tonnes | Grade | Gold | |
Plutonic Underground | - | - | - | 7,448 | 2.6 | 616 | 7,448 | 2.6 | 616 |
Notes: | |
1. | Ore Reserve estimated at 1.5g/t Au cut-off; |
2. | Reserves are a combination of detailed mine design and Stope Optimised shapes. SO inputs include: Incremental Stoping and Grade Control Cost = AUD$59/t; Processing Costs = AUD$27.40/t ore; Site Administration Cost = AUD$16.70/t ore; Metallurgical Recovery = 86.5%; Royalties = 2.5%; Gold Price = AUD$2,700/oz; Minimum mining width = 3m. |
3. | Mining dilution of 25% and ore recovery of 90% is applied. |
4. | Numbers may not add up due to rounding |
Plutonic East Ore Reserves
An Ore Reserve Estimation is the economically mineable part of a Measured and/or Indicated Mineral Resource. It includes diluting materials and allowances for losses, which may occur when the material is mined or extracted.
Following is a summary of the Plutonic East Ore Reserves, as at 01 July 2024.
Deposit | Proved | Probable | Total | ||||||
Tonnes | Grade | Gold | Tonnes | Grade | Gold | Tonnes | Grade | Gold | |
Plutonic East Underground | - | - | - | 456 | 2.5 | 36 | 456 | 2.5 | 36 |
Notes: | |
1. | Ore Reserve estimated at 1.5g/t Au cut-off; |
2. | Reserves are a combination of detailed mine design and Stope Optimised shapes. SO inputs include: Incremental Stoping and Grade Control Cost = AUD$59/t; Processing Costs = AUD$27.40/t ore; Site Administration Cost = AUD$16.70/t ore; Metallurgical Recovery = 84%; Royalties = 2.5%; Gold Price = AUD$2,700/oz; Minimum mining width = 3m, with a 0.5m dilution halo applied to Hangingwall and Footwall. |
3. | Ore recovery of 90% is applied. |
4. | Numbers may not add up due to rounding |
K2 Underground Ore Reserves
An Ore Reserve Estimation is the economically mineable part of a Measured and/or Indicated Mineral Resource. It includes diluting materials and allowances for losses, which may occur when the material is mined or extracted.
Following is a summary of the K2 Ore Reserves, as at 01 July 2024.
Deposit | Proved | Probable | Total | ||||||
Tonnes | Grade | Gold | Tonnes | Grade | Gold | Tonnes | Grade | Gold | |
K2 Underground | - | - | - | 147 | 4.3 | 20 | 147 | 4.3 | 20 |
Notes: | |
5. | Ore Reserve estimated at 1.7g/t Au cut-off; |
6. | Reserves are a combination of detailed mine design and Stope Optimised shapes. SO inputs include: Incremental Stoping and Grade Control Cost = AUD$70.80/t; Processing Costs = AUD$27.40/t ore; Site Administration Cost = AUD$16.70/t ore; Haulage Cost = AUD$12.0/t ore; Metallurgical Recovery = 91%; Royalties = 2.5%; Gold Price = AUD$2,700/oz; Minimum mining width = 2.75m, with a 0.5m dilution halo applied to Hangingwall and 0.25m dilution halo applied to Footwall. |
7. | Ore recovery of 95% is applied. |
8. | Numbers may not add up due to rounding |
Henty Underground Mineral Resource Estimate
Following is a summary of the Henty Underground Ore Reserves, as at 01 July 2024.
Deposit | Measured | Indicated | Inferred | Total | ||||||||
Tonnes | Grade | Gold | Tonnes | Grade | Gold | Tonnes | Grade | Gold | Tonnes | Grade | Gold | |
Henty Underground | - | - | - | 3.7 | 3.5 | 410 | 0.6 | 2.9 | 52 | 4.2 | 3.4 | 462 |
Table 6: Henty Underground Mineral Resource Estimate
Notes: | |
1. | Mineral Resource estimated at 1.5g/t Au cut-off and reported within underground Shape Optimiser (SO). SO inputs include: Gold Price AUD$3,500/oz, Metallurgical Recovery = 92%; Royalties = 5.9%; Minimum mining width = 1.5m; Minimum stope height=16m, Minimum stope strike=5m |
2. | Numbers may not add up due to rounding |
Henty Underground Ore Reserves
An Ore Reserve Estimation is the economically mineable part of a Measured and/or Indicated Mineral Resource. It includes diluting materials and allowances for losses, which may occur when the material is mined or extracted.
Following is a summary of the Henty Ore Reserves, as at 1 July 2024.
Deposit | Proved | Probable | Total | ||||||
Tonnes | Grade | Gold | Tonnes | Grade | Gold | Tonnes | Grade | Gold | |
Henty Underground | - | - | - | 1,207 | 4.0 | 154 | 1,207 | 4.0 | 154 |
Notes: | |
1. | Ore Reserve estimated at 1.7g/t Au cut-off; |
2. | Reserves are a combination of detailed mine design and Stope Optimised shapes. SO inputs include: Mining, Maintenance and Grade Control Cost = AUD$90/t; Processing Costs = AUD$28/t ore; Site Administration Cost = AUD$24/t ore; Metallurgical Recovery = variable, with average of 92.6%; Royalties = 5.9%; Gold Price = AUD$3,000/oz; Minimum mining width = 1.5m. |
3. | Mining modifying factors are applied dependant on stope method, whereby 10-15% dilution is applied to the in-situ material, and ore recovery ranges from 92 - 95%. |
4. | Numbers may not add up due to rounding |
Group Ore Reserves and Mineral Resources
Ore Reserves
Ore Reserve | Proved | Probable | Total | |||||||
Tonnes | Grade | Gold | Tonnes | Grade | Gold | Tonnes | Grade | Gold | ||
Plutonic Underground | - | - | - | 7,448 | 2.6 | 616 | 7,448 | 2.6 | 616 | |
Plutonic East Underground | - | - | - | 456 | 2.5 | 36 | 456 | 2.5 | 36 | |
Trident Underground | - | - | - | 1,199 | 4.7 | 182 | 1,199 | 4.7 | 182 | |
Trident West Open Pit | - | - | - | 144 | 1.4 | 6 | 144 | 1.4 | 6 | |
K2 Underground | - | - | - | 147 | 4.3 | 20 | 147 | 4.3 | 20 | |
Henty Underground | - | - | - | 1,207 | 4.0 | 154 | 1,207 | 4.0 | 154 | |
Group Total | - | - | - | 10,601 | 3.0 | 1,015 | 10,601 | 3.0 | 1,015 | |
Mineral Resources
Mineral Resource | Measured | Indicated | Inferred | Total | ||||||||
Tonnes | Grade | Gold | Tonnes | Grade | Gold | Tonnes | Grade | Gold | Tonnes | Grade | Gold | |
Plutonic Underground | - | - | - | 17.2 | 2.9 | 1,592 | 0.7 | 2.6 | 62 | 17.9 | 2.9 | 1,654 |
Trident Underground | - | - | - | 1.6 | 5 | 257 | 2.6 | 3 | 251 | 4.2 | 3.7 | 508 |
Trident Open Pit | - | - | - | 0.4 | 1.6 | 16 | - | - | - | 0.4 | 1.6 | 16 |
K2 Underground | - | - | - | 0.2 | 4.2 | 31 | 0.5 | 3.4 | 49 | 0.7 | 3.6 | 81 |
Plutonic East Underground | - | - | - | 0.9 | 2.8 | 80 | 1.3 | 2.4 | 102 | 2.2 | 2.5 | 182 |
Triple-P & Zone-B UG | - | - | - | - | - | - | 0.2 | 4.3 | 24 | 0.2 | 4.3 | 24 |
Trident West Open Pit | - | - | - | 0.3 | 1.1 | 9 | - | - | - | 0.3 | 1.1 | 9 |
Marwest & Mars Open Pit | - | - | - | 0.7 | 2 | 45 | - | - | - | 0.7 | 2 | 45 |
Mareast Open Pit | - | - | - | 0.5 | 1.9 | 30 | - | - | - | 0.5 | 1.9 | 30 |
EastMareast Open Pit | - | - | - | 0.2 | 1.1 | 8 | - | - | - | 0.2 | 1.1 | 8 |
Wedgetail Open Pit | - | - | - | 0.2 | 1.7 | 10 | - | - | - | 0.2 | 1.7 | 10 |
PHB-1 (K3) Open Pit | - | - | - | 0.6 | 2 | 39 | 0.2 | 1.4 | 11 | 0.8 | 1.9 | 50 |
K1 Open Pit | - | - | - | 0.7 | 1.8 | 42 | 0.8 | 1.7 | 47 | 1.6 | 1.8 | 89 |
Triple-P & Triple-P Sth OP | - | - | - | 0.6 | 2.1 | 42 | 0.5 | 1.4 | 21 | 1.1 | 1.8 | 63 |
Albatross & Flamingo OP | - | - | - | - | - | - | 0.9 | 1.4 | 38 | 0.9 | 1.4 | 38 |
Cinnamon Open Pit | - | - | - | 1.5 | 1.8 | 86 | 0.5 | 1.9 | 32 | 2 | 1.8 | 119 |
Total Plutonic and Marymia | - | - | - | 25.6 | 2.8 | 2,287 | 8.2 | 2.4 | 637 | 33.9 | 2.7 | 2,926 |
Henty Underground | - | - | - | 3.7 | 3.5 | 410 | 0.6 | 2.9 | 52 | 4.2 | 3.4 | 462 |
Total Henty | - | - | - | 3.7 | 3.5 | 410 | 0.6 | 2.9 | 52 | 4.2 | 3.4 | 462 |
Boyd's Dam | - | - | - | 0.5 | 5 | 73 | 0.1 | 5 | 20 | 0.6 | 5 | 93 |
Iris Zone | - | - | - | - | - | - | 0.1 | 26.2 | 70 | 0.1 | 6 | 70 |
Total Bendigo | - | - | - | 0.5 | 5 | 73 | 0.2 | 13.3 | 90 | 0.7 | 7.7 | 163 |
Group Total | - | - | - | 30 | 2.9 | 2,770 | 9 | 2.7 | 779 | 39 | 2.8 | 3,551 |
Material information summary as required under ASX Listing Rule 5.16 and 5.17. |
HENTY GOLD MINE, TASMANIA
Mining
Henty has been in operation for 28 years, whereby various mining methods have been used in the past (room and pillar, longhole open stoping with paste fill/ rock fill or no fill). The mining method used for the OREplan is a combination of longhole stoping and benching.
Stope designs assume a minimum mining width of 1.5m, minimum stope length of 10m and stope height to a maximum of 15m. The intervals vary from 12-15m, which is deemed an appropriate method for control of dilution, reduction of pillars and ore loss, ground control, safety and regional stability. Dilution of 15% is applied to the in-situ stope ore tonnes and the ore recovery of 92-95% is applied, depending on extraction method.
Unclassified and inferred material have not been included within the Ore Reserves, however if the material is mined as a consequence to mining an Ore Reserve stope, then material had a zero-grade assigned and was therefore treated as dilution waste.
Processing
Henty's process plant has an annual plant capacity of 300,000 tonnes and comprises a semi-autogenous mill (SAG) feeding a conventional carbon-in-leach (CIP) circuit. Catalyst has operated the plant since January 2021. Feed grade during that time has been 3.5-4.0g/t. The 92% recovery used in the ORE plan is consistent with current plant recoveries and there is no foreseeable reason to change to projected recovery.
Economic assumptions
- Mine operating costs (including mining, development, maintenance and grade control drilling) have been based on recent operating history and estimated mining physicals. Costing for sustaining capital items have been based off recent history, vendor quotes or management estimates.
- Operating costs for the processing plant have been estimated using recent operating history and estimated physicals.
- Other operating costs including power and administration have been estimated using recent operating history.
- Royalties are based on existing royalties with the Tasmanian government and third parties.
PLUTONIC UNDERGROUND DEPOSIT, PLUTONIC GOLD BELT, WA
Mining
Plutonic Underground has been in operation for 28 years, whereby various mining methods have been used in the past (room and pillar, longhole open stoping with paste fill/ rock fill or no fill). The mining method used for the ORE is longhole stoping.
Stope designs assume a minimum mining width of 3.0m, minimum stope length of 5m and stope height of 5-25m. For stope tonnes dilution of 25% is applied to the in-situ designs and stope ore recovery of 90% is applied.
Processing
The metallurgical characteristics of the Plutonic are well known, simple and are applicable to feed through Plutonic Processing "Carbon in Leach circuit" Plant.
The process plant consists of an open circuit jaw crusher, coarse ore stockpile, semi-autogenous grinding mill and ball mills, two leach tanks, and six carbon adsorption tanks. Plant performance for the past five years indicates reasonable performance, with recoveries ranging from 76% to 90%, and an average recovery in 2024 of 86.5%. Metallurgical recoveries used in the ORE were based on site production data and detailed metallurgical testing to an appropriate standard.
Economic assumptions
Mine operating costs (including mining, development, maintenance and grade control drilling) have been based on recent operating history at the Plutonic Gold Mine and estimated mining physicals. Costing for sustaining capital items have been based off recent history, vendor quotes or management estimates.
Operating costs for the processing plant have been estimated using recent operating history
Other operating costs including power, administration, camp services and flights have been estimated using recent operating history.
Royalties are based on existing royalties with the Western Australian government.
PLUTONIC EAST DEPOSIT, PLUTONIC GOLD BELT, WA
Mining
Plutonic East underground operated from 2001 until 2012 with production of 812kt's @ 5.3g/t for 137.3koz.
The mining method assumed for Plutonic East is long-hole 'flat to sub vertical' stoping, the mining method previously applied at Plutonic East Underground. If a stope can be backfilled with waste rock, it will be filled.
Plutonic East was in operation from 2001 to 2012 whereby flat to sub vertical bench stopes were extracted successfully along strike of the ore system. A small percentage of the stopes were waste loose backfilled to provide overlying access and/or passive hangingwall support. The historic voids have been incorporated into the MRE, with an additional 2.5m depletion skin around the stope voids incorporated into the MRE.
SO input parameters include a 1.5 g/t Au cut-off, minimum mining width 3m, minimum stope length of 5m, stope height of 5-25m and a gold price of A$$2,700/oz.
Processing
The metallurgical characteristics of Plutonic East are well known, having been previously operated as an underground mine. Catalyst proposes to process Plutonic East through the Plutonic processing plant.
A metallurgical recovery of 84% was used in the COG for Plutonic East.
Economic assumptions
Catalyst plans to mine the Plutonic East deposit on an owner-operator basis. Given the similarities in operational framework between the existing Plutonic operations and Plutonic East, Plutonic's historical mining costs have been used as an input to the mining cost estimate. Plutonic East's proximity to Plutonic allows many synergies, including existing infrastructure, an existing employee pool, and systems and structures in place to run an underground mining operation.
Plutonic East ore will be processed at the Plutonic processing plant. Operating costs for the processing plant have been estimated using recent operating history.
Other operating costs including power and administration have been estimated using recent operating history at the Plutonic Gold Mine.
Royalties are based on existing royalties with the Western Australian government.
K2 DEPOSIT, PLUTONIC GOLD BELT, WA
Mining
K2 underground operated from 1997 to 1998, with only the portal and decline developed. The Marymia Operation (including the K2 underground) was placed under Care and Maintenance in mid-1998 because of a depressed gold price environment. The overlying open pit was mined in 1992 to 1995 with a production of 966kt's @ 4.0g/t for 116koz.
Proposed mining practices for K2 are based on the current operational practises of the neighbouring Plutonic underground mine as well as reflecting the historical mining methods proposed for K2. K2 was in operation from 1997-1998 whereby narrow up hole stopes were planned to be extracted along strike of the ore system. Previous technical studies and assessments have demonstrated that the proposed mining methods are technically achievable and are economically viable.
SO input parameters include a 1.7 g/t Au cut-off, minimum mining width 2.75m, minimum stope length of 8m, stope height of 17m and a gold price of A$$2,700/oz. The orientation of SO's is variable depending on the geometry of the mineralisation
Environmental, social and other factors have been considered internally.
Processing
The metallurgical characteristics of K2 are well known, with a number of feasibility studies having been completed in the past. Catalyst proposes to process K2 through the Plutonic processing plant.
K2 was historically processed at the now decommissioned Marymia Process Plant. Historical records and recent test works have indicated a 91% average recovery.
Economic assumptions
Catalyst plans to mine the K2 deposit on an owner-operator basis. Given the similarities in operational framework between the existing Plutonic operations and K2, Plutonic's historical mining costs have been used as an input to the mining cost estimate. K2's proximity to Plutonic allows many synergies, including existing infrastructure, an existing employee pool, and systems and structures in place to run an underground mining operation.
K2 ore will be processed at the Plutonic processing plant. Operating costs for the processing plant have been estimated using recent operating history
Other operating costs including power and administration have been estimated using recent operating history at the Plutonic Gold Mine.
Royalties are based on existing royalties with the Western Australian government and third parties.
TRIDENT DEPOSIT, PLUTONIC GOLD BELT, WA
Refer to Catalyst Metals Limited's ASX announcement on 3 July 2024 – Trident Maiden Reserve Underpins New Low-Cost Development.
ZONE F EXPLORATION TARGET
Exploration targets for Plutonic Main were generated as follows:
- Each exploration area used an adjacent portion (with similar scale extents) of the 2023 Plutonic MRE as a proxy for total mineralization endowment.
- As Plutonic is a stacked lode system, each proxy area was then reported as a grade tonnage curve for indicated and inferred material over a given volume of mine mafic (being the host lithology).
- Each proxy grade tonnage curve was then volume corrected against the volume of mine mafic in the relevant target area.
- A confidence factor was then applied to each target area relative to its proxy, this ranged between 50 and 75% of the initial target grade tonnage curve. This factor allows for a possible decrease in mineralisation intensity and also takes into consideration the relative level of geological and volume uncertainty related to the mine mafic host lithology.
- A second correction factor was applied to account for conversion into eventual mining inventory, this was 60% of the outcome of the previous calculation. This represents an estimated Reserve conversion factor for virgin areas. It is a higher factor than the average for Plutonic, however the majority of Plutonic Reserves are in remnant areas which have a lower conversion factor.
- All exploration targets use a nominal 1.5 g/t cutoff grade.
The Exploration Target has been prepared and reported in accordance with the 2012 edition of the JORC Code. The potential quantity and grade of the Exploration Target is conceptual in nature. There has been insufficient exploration to estimate a Mineral Resource. It is uncertain if further exploration will result in the estimation of a Mineral Resource.
The following ranges are considered appropriate for the exploration target for Zone F :
- Ounces: 30 – 45koz
- Tonnes: 350 kt – 430 kt
- Grade: 2.7 – 3.2
Material information summary as required under ASX Listing Rule 5.9. |
ORE RESERVE ESTIMATES (Plutonic)
1. Level of Study
The Ore Reserve has been determined based on the current operational practises of the Plutonic underground mine. Plutonic has been in production as an underground operation since 1995. The level of accuracy of the of the mine plan is technically achievable and operationally executable.
2. Classification
A 'Probable Ore Reserve' is the economically mineable portion of an Indicated Mineral Resource.
The Ore Reserves classification reflects the Competent Person's view of the deposit. Only Probable reserves have been declared and are based on Indicated Resources following consideration of modifying factors. No probable Ore Reserves are derived from Measured Resources, as there was no Measured Resource within the MRE. There is a high level of confidence in the modifying factors applied because they based on 'actual' operating performance currently being achieved at the Plutonic mine.
3. Mining Method
Previous operational performance has demonstrated that the current mining method of Long Hole Open Stope is technically achievable and is economically viable.
The historic voids have been incorporated into the Mineral Resource Estimate and coded to ensure the method of fill determines proximity of stope shape generation.
Unclassified and inferred material have not been included within the Ore Reserves, however if the material is mined as a consequence to mining an Ore Reserve estimated stope, then material had a zero grade assigned and was therefore treated as waste.
The mining modifying factors used in the Ore Reserves calculations are based on historically achieved Mining Dilution (25%) and Recovery (90%) factors. The current mine plan ethos and mining method will continue for mining of Ore Reserves.
4. Processing
The metallurgical characteristics of the Plutonic are well known, simple and are applicable to feed through Plutonic Processing "Carbon in Leach circuit" Plant.
The process plant ("PP1") consists of an open circuit jaw crusher, coarse ore stockpile, semi-autogenous grinding ("SAG") mill and ball mills, two leach tanks, and six carbon adsorption tanks. A three-stage hard rock crushing circuit was incorporated in 1994 which included a fine ore bin and an additional ball mill. Plant performance for the past five years indicates reasonable performance, with recoveries ranging from 76% to 90%, and an average recovery in 2024 of 86.5%. Metallurgical recoveries used to generate the Ore Reserves were based on site production data and detailed metallurgical testing to an appropriate standard.
5. Cut-off Grade
The cut-off grade applied to the Ore Reserve estimate is defined as the $A value per tonne of ore after consideration of all costs (mining, processing, Site administration), metallurgical recoveries,transport costs and royalties.
Stope optimiser shapes were initially categorised by using the operating cut-off grade (1.5g/t). Subsequently, stope shapes that were spatially distant from the mine's footprint were deleted to filter inventory requiring excessive development costs to access. Development material was considered in the Ore Reserve estimate if the material could cover the cost of haulage and processing (1.0g/t).
Inputs into the cut-off grade calculation include: Incremental Stoping and Grade Control Cost = AUD$59/t, Processing Costs = AUD$27.40/t ore, Site Administration Cost = AUD$16.70/t ore, Metallurgical Recovery = 86.5% (average across all mining units), Royalties = 2.5% and utilised a Gold Price = AUD$2,700/oz.
6. Estimation Methodology
The Ore Reserves estimate is reported within an underground Shape Optimiser (SO) evaluation from the July 2024 depleted MRE model. SO input parameters include a 1.5 g/t Au cut-off, minimum mining width 3m, minimum stope length of 5m, stope height of 5-25m and a gold price of A$$2,700/oz. The orientation of SO's is variable depending on the geometry of the mineralisation.
Plutonic has been in operation for 28 years, whereby various mining methods have been used in the past (room and pillar, LHOS with paste fill/ rock fill or no fill) The historic voids have been incorporated into the MRE and coded to ensure the method of fill determines proximity of stope shape generation. Unclassified and Inferred material have not been included within the Ore Reserves, however if the material is mined as a consequence to mining an Ore Reserve estimated stope, then material had a zero grade assigned and was therefore treated as waste.
7. Other Material Factors, Approvals and Infrastructure
Activities undertaken onsite are undertaken in accordance with the environmental approvals. Monitoring programs are conducted to ensure that key approval and licence requirements are complied with. Mining tenements and approvals are in good standing. The Company has demonstrated a strong environmental and social performance, there are no identified threats that place the companies social licence to operate at risk.
The Plutonic Gold Mine is a well-established mine which has services and infrastructure consistent with an isolated area operating mine. The existing site infrastructure can support the mine plans as historically the site has successfully operated at production rates significantly higher than those envisaged within the Ore Reserves Plan.
ORE RESERVE ESTIMATES (Henty)
1. Level of Study
The declaration of Henty Ore Reserve Estimation is based on the Company's internal studies which demonstrate continued economic viability of the currently operating Henty mine. The level of accuracy of the of the mine plan is technically achievable and operationally executable.
2. Classification
A 'Probable Ore Reserve' is the economically mineable portion of an Indicated Mineral Resource.
The Ore Reserves classification reflects the Competent Person's view of the deposit. Only Probable reserves have been declared and are based on Indicated Resources following consideration of modifying factors. No probable Ore Reserves are derived from Measured Resources, as there was no Measured Resource within the MRE. There is a high level of confidence in the modifying factors applied because they based on 'actual' operating performance currently being achieved at the Plutonic mine.
3. Mining Method
Henty has been in operation for 28 years, whereby various mining methods have been used in the past (room and pillar, LHOS with paste fill/ rock fill or no fill) The historic voids have been incorporated into the MRE and coded to ensure the method of fill determines proximity of stope shape generation. The mining method used for the Reserve is a combination of Longhole Stoping and Benching.
Dilution of 15% is applied to the in-situ stope ore tonnes and the ore recovery of 92-95% is applied, depending on extraction method. Waste development has a 15% dilution factor applied; however Ore development had no dilution applied. Development has 100% mining recovery applied.
Majority of the stopes will be filled using unconsolidated rock fill trucked from surface or underground development waste. This will improve stope stability and increase ore recovery while minimising the backfill costs. Stopes will be filled with waste rock from development where possible to minimise the trucking requirements.
4. Processing
The Henty Gold Mine has been operational since 1996. The process plant has an annual plant capacity of 300,000 tonnes and comprises a semi-autogenous mill (SAG) feeding a conventional carbon-in-leach (CIP) circuit. Catalyst has operated the plant since January 2021. Feed grade during that time has been 3.5-4.0g/t. The 94% recovery used in the ORE estimation is consistent with current plant recoveries and there is no foreseeable reason to change to projected recovery.
5. Cut-off Grade
Stope optimiser shapes were initially categorised by using the operating cut-off grade (1.7g/t). Subsequently, stope shapes that were spatially distant from the mine's footprint were deleted to filter inventory requiring excessive development costs to access. Operating cut-off grades applied to the Ore Reserve Estimate were 1.7g/t for stope shapes (after all forms of dilution and ore loss) and 1.0g/t for ore development shapes (after applying development profiles to the ore boundary).
Cost and modifying factors used to determine the above COG's were direct underground operating (mining and geology) A$ 90/ore t, processing A$ 28/ore t, site G&A A$24/ore t, metallurgical recovery 92.0%, royalties 5.9% NSR (variable using grade recovery curve) and gold price of A$3,000/oz.
6. Estimation Methodology
The Ore Reserves estimate is reported within an underground Shape Optimiser (SO) evaluation from the depleted resource model. SO input parameters include a 1.7 g/t Au cut-off, Gold price of AUD$3,000/oz, minimum mining width of 1.5m, minimum stope length of 10m. Control strings have been used to control stope height to a maximum of 15m. The intervals vary from 12-15m, which is deemed an appropriate method for control of dilution, reduction of pillars and ore loss, ground control, safety and regional stability. Stable stope dimensions using a maximum HR=4m have been based on geotechnical assessment.
The orientation of the SO's is variable depending on the geometry of the minerialisation.
7. Other Material Factors, Approvals and Infrastructure
Activities undertaken onsite are undertaken in accordance with the environmental approvals. Monitoring programs are conducted to ensure that key approval and licence requirements are complied with. The Company has demonstrated a strong environmental and social performance, there are no identified threats that place the companies social licence to operate at risk.
All Henty Mine infrastructure is in place. The Henty TSF is approved for a further 6m height lift which will allow production through to 2030.
MINERAL RESOURCE ESTIMATE (Henty)
Material information summary as required under ASX Listing Rule 5.8 and JORC Code (2012) reporting guidelines.
1. Mineral Resource Statement
The Mineral Resource Statement for the Henty Gold Mine Mineral Resource estimate was prepared during April 2024 and is reported according to the Australasian Code for Reporting of Exploration Results, Mineral Resources and Ore Reserves (the 'JORC Code') 2012 edition.
The Mineral Resource estimate includes 57,606m of drilling from 5025 diamond drill holes (DD), 5116 Face Samples and 1141 Sludge holes completed since 1996. The depth from surface to the current vertical limit of the Mineral Resources is approximately 935 m (1650 mRL).
In the opinion of Catalyst, the resource evaluation reported herein is a reasonable representation of the global gold Mineral Resources within the Henty Gold Mine deposit, based on sampling data from Diamond drilling Sludge holes and Channel Samples available as of 28 January 2024. Mineral Resources are reported below topography and are comprised of fresh rock only.
The Henty Gold Mine March 2024 Mineral Resource Estimate (MRE) has been undertaken with a focus on delineating areas of the MRE with Reasonable Prospects for Eventual Economic Extraction (RPEEE) by underground mining methods. The MRE has been constrained within an underground Shape Optimiser (SO) evaluation from the depleted resource model.
SO input parameters include a 1.5 g/t Au cut-off, minimum mining width of 1.5m minimum stope length of 5m, stope height of 16m. The orientation of SO's is variable depending on the geometry of the mineralisation.
The entire MRE consists of Indicated and Inferred Mineral Resources. No Measured Mineral Resources have been reported at this stage of the project.
The Mineral Resource Statement is presented in Table 1.
Table 1: Henty Gold Mine March 2024 MRE (at 1.5 g/t Au cut-off)
Classification | Tonnes Mt) | Au g/t | Ounces (kOz) |
Indicated | 3.69 | 3.5 | 410.4 |
Inferred | 0.55 | 2.9 | 52.3 |
Total | 4.24 | 3.4 | 462.4 |
Notes: | ||
1. | Mineral Resource estimated at 1.5g/t Au cut-off and reported within underground Shape Optimiser (SO). SO inputs include: | |
Gold Price AUD$3,500/oz, Metallurgical Recovery = 92%; Royalties = 5.9%; Minimum mining width = 1.5m; Minimum stope height=16m, Minimum stope strike=5m | ||
2. | Numbers may not add up due to rounding | |
A total of 881,623 m of drilling from 6,756 diamond drill holes, 1,452 sludge holes and 5,822 channel samples were available for the Mineral Resource estimate. Mineralisation interpretations were informed by diamond, sludge and channel samples (14,030 holes, of which 11,282 intersect the resource) for 57,606 m of drilling intersecting the resource.
2. Competent Person's Statement
The information in the report to which this Mineral Resource Statement is attached that relates to the estimation and reporting of gold Mineral Resources at the Henty Gold Mine deposit is based on information compiled by Mr Andrew Finch, BSc, a Competent Person who is a current Member of Australian Institute of Geoscientists (MAIG 3827). Mr Finch, Geology Manager, at Catalyst Metals Ltd has sufficient experience relevant to the style of mineralisation and deposit type under consideration and to the activities being undertaken to qualify as a Competent Person as defined in the 2012 Edition of the Australasian Code for Reporting of Exploration Results, Mineral Resources and Ore Reserves. Mr Finch consents to the inclusion in the report of matters based on his information in the form and context in which it appears.
3. Drilling Techniques
Sampling data for the Henty Gold Mine MRE includes diamond drilling (DD), face channel sampling (CH) and sludge sampling (SL) techniques.
The sampling database has been compiled from information collected when the Project was under ownership of numerous companies including (listed from most recent):
- Catalyst Metals (2021 to current)
- Diversified Minerals (2016 to 2020)
- Unity Mining (2009 to 2016)
- Barrick Gold (2006 to 2009)
- Placer Dome (2003 to 2006)
- Aurion Gold (2001 to 2003)
- RGC/Goldfields (1996 to 2001).
For the most recent drilling completed by Catalyst, DD collar positions are set out by Mine Surveyors. The drilling crew has an azi-reader device that enables them to set up at the correct azimuth and dip according to the drillhole plan. Final collar positions are then picked up by Mine Surveyors at hole completion. For downhole surveys taken up to January 2019, a Devi-flex tool was used, with surveys taken every few metres. From January 2019 onwards, a downhole Gyroscopic tool was employed.
For underground workings, development drives are regularly picked up by Mine Surveyors. At stope completion, a cavity monitoring system is generally used to model the final voids.
The location of face channel samples is determined by measuring the distance from the closest survey station. The face channel is treated as a short drillhole, with collar and survey information stored in the site database.
All reported coordinates are referenced to the grid system Geocentric Datum of Australia 1994 (GDA94).
Underground mobile DD drill rigs are utilised to produce either LTK60 or NQ2 size core. Drill core is not routinely oriented.
4. Historical Drilling
Details relating to geospatial location protocols for drilling earlier than 2009 are unavailable; however, Catalyst considers that it is reasonable to assume that industry standard techniques were employed.
5. Sampling and Sub-Sampling Techniques
For drillhole data, either whole core or half core is submitted for analysis. In areas where infill drilling is required, whole core may be submitted given that there are other holes available with half core for future reference. Sample recovery is recorded for DD core samples as part of geotechnical logging
Samples are taken at 0.2–1.2 m intervals and honour lithological boundaries, with intervals entered in the same spreadsheet that is used for logging. Core is cut with an automatic core saw. Samples are placed in calico bags and then into polyweave bags for transport to the laboratory. Certified reference materials (CRMs) and blank material are inserted in the sample stream to monitor analytical bias and carry-over contamination, respectively.
For underground workings, face channel sampling is carried out at grade height (~1.5 m). A duplicate sample is taken on all faces to monitor sample precision. Samples are taken at 0.2–1.2 m intervals and honour different rock types, alteration zones, and mineralised zones. CRMs and blank material are inserted in the sample stream to monitor analytical bias and carry-over contamination, respectively.
Samples are placed in an oven on site after the geologist returns from underground. The primary laboratory (ALS in Burnie) collects the samples each morning and generally provides results later that day, giving a 24–36-hour sample turnaround.
Sludge holes are drilled at Henty in areas where additional grade control data is needed to confirm grades adjacent to existing development. Sludge holes are drilled with underground production rigs, with samples collected by operators for each drill rod from drill return fines, and holes flushed between samples. Sludge hole collar positions are marked out by site surveyors and picked up once holes are completed, with hole dip and azimuth not measured and taken from design documents. Sludge samples are processed at the Burnie ALS laboratory using fire assay, with crushed rock standard and blank material is submitted with each sludge sample batch.
6. Historical Sampling
Details relating to drilling techniques, quality assurance (QA) protocols and quality control (QC) results for data gathered prior to 2009 is largely unavailable. However, the information provided indicates that sampling techniques and sample preparation were broadly similar to that of the current drilling techniques. QA protocols were employed, in some form, for the analytical data gathered during this period.
7. Sample Analysis Method
Historical information provided indicates that several analytical laboratories have been used over the history of the Project, and analytical methodologies have varied slightly over time. Typically fire assay with determination by atomic absorption spectrometry (AAS) has been used.
Currently all samples are submitted to ALS Burnie for gold analysis. Samples are crushed and pulverised prior to selection of a 30 g subsample for fire assay with determination by AAS.
Occasionally, bismuth, silver, copper, lead, zinc, arsenic and molybdenum analyses are completed to assist with understanding the nature of the mineralisation and for metallurgical assessment. Copper, for example, may consume cyanide during processing. If required, pulps are sent from Burnie to ALS Townsville for multi- element determination.
In 2020, CSA Global completed a detailed review of the QC data for the period 2016 to 2020 and the analytical results were considered as being acceptable to support the MRE.
Catalyst submitted a total of 1,856 blank samples between January 2021 and December 2022 and 99% of the blank results were within acceptable limits. Fifteen blank failures (1%) were recorded during the period. The batches with failed blanks were re-assayed. This is not considered as presenting a material issue to the MRE.
Catalyst submitted a total of 2,234 standards between January 2021 and December 2022. A total of eight different types of CRMs were submitted to the laboratory and a new CRM; OREAS 251b was introduced in December 2022. CSA Global reviewed the results of CRM submissions and concluded that the submitted CRMs performed within acceptable limits.
Although sample collection, sample preparation, sample logging and analytical techniques have varied over the Project's history, all can be considered as industry standard at the time. The amount of QC data that was collected has also varied over the Project's history, but overall is considered as being acceptable to support the MRE.
8. Geology and Geological Interpretation
The Henty deposit lies within the Mount Read Volcanic (MRV) Belt in western Tasmania. The most important metallogenic event in Tasmania coincided with the deposition of the MRV, which occurred from the early middle Cambrian to the early late Cambrian. The main mineralised belt of the MRV between Mount Darwin and Hellyer is the Central Volcanic Complex (CVC). The CVC is dominated by proximal volcanic rocks (rhyolite and dacite flows, domes and cryptodomes and massive pumice breccias) and andesite and rare basalt (lavas, hyaloclastites, and intrusive rocks) deposited in a marine environment.
The Cambrian Tyndall Group Comstock Formation hosts much of the mineralisation at the Henty deposit. A unit of quartz-bearing volcaniclastic sandstone and conglomerate of mixed felsic and andesitic provenance, with the latter common towards the base, and minor felsic and andesitic lavas and intrusive rocks and welded ignimbrite.
The Henty Gold Mine consists of a series of small high-grade lenses of gold mineralisation in quartz-sericite altered volcaniclastic and volcanic rocks that occupy a large sub-vertical quartz-sericite alteration zone.
There are three main alteration assemblages intimately associated with the gold mineralisation as follows:
- MV alteration assemblage:
- Sulphide-poor, quartz+sericite alteration facies ("MV") is distinguished by pale green sericite concentrated in cleavage planes that envelop domains of intense silicification. The boundaries between sulphide-rich domains ("MZ") and MV domains are typically very sharp. MV contains minor chalcopyrite and galena, as small coarse-grained concentrations in siliceous domains, with sparse sphalerite and pyrite. Purple fluorite occurs in places.
- MQ alteration assemblage:
- High gold grades are most commonly hosted in an intense silicification alteration facies ("MQ"). The MQ-style alteration is generally 5–50 m stratigraphically below the base of the Lynchford Tuff and generally shows a close spatial association with MV alteration. Boundaries between MV and MQ altered rocks are sharp. The MQ has been repeatedly fractured and annealed, with multiple generations of fine veinlets of quartz, sulphide and calcite, in contrast to the adjacent sericite-rich MV which behaved in a ductile manner during deformation. The distinguishing feature of the MQ is that all feldspars and sheet silicates are replaced by quartz. Late irregular fractures within the MQ contain free gold, together with pyrite, chalcopyrite, galena, and minor tellurides and bismuth sulphosalts.
- MZ alteration assemblage:
- Within the footwall of the massive pyrite horizon, the host rocks are altered to a quartz+sericite+pyrite assemblage with disseminated base metal sulphides ("MZ"). This assemblage commonly has an apparent fragmental texture and is best developed in coarse volcaniclastic rocks. Sulphide content is relatively high, averaging ~5%, with typically 0.1–1 ppm Au. The appearance of base metal sulphides is usually a visual indicator of anomalous gold grades.
A total of 881,623 m of sampling from 6,756 diamond drill holes, 1,452 sludge holes and 5,822 channel samples were available for the Mineral Resource estimate and supported by a nominal drill density of 10 x15m along strike.
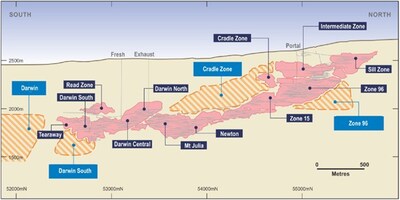
The Henty deposit comprises 12 individual model areas all of which have been updated in this MRE (Cradle Zone, Darwin Central, Darwin North, Darwin South, Intermediate Zone, Newton-Mount Julia, Read Zone, Sill Zone, Tear Away Zone, Tyndall Zone, Zone 15 and Zone 96).
Gold mineralisation domains were interpreted primarily on geological logging, face channel sampling and geological mapping of underground exposures, based on lithology, grade distribution, major faults and geometry.
Interpretations of domain continuity were undertaken in Datamine software using all available drillholes, face channel samples and sludge holes. Interpretation of each ore domain was constrained by a combination of gold grades (nominally 0.5-1 g/t ) and lithology, with individual lenses generally conforming to a particular style of alteration.
The domains to the north of the Moa fault steeply dip to the west with a thickness of 1-8 m and run semi-parallel to the NNE striking Henty Fault; south of the Moa fault the domains trend from NNE to NE. The mineralisation extends over a strike length (North – South) of approximately 3200 m and currently extends to a depth of approximately 850 m below surface.
Drillhole data spacing varies somewhat over the deposit area. Density of drilling is selected to match the complexity of mineralisation, which is recognised as varying between different domains. Most deposits are drilled out at 10–15 m spacings (along strike and down dip). Drillholes are clustered in some areas, and often become more widely spaced at the edges of the deposits or in areas where the mineralisation is low tenor and delineation of economic material is unlikely.
For underground workings face channel sampling is carried out at grade height (~1.5 m) along ore development drives prior to stoping. Approximately every second cut (or ~6.0 m strike length) is generally sampled, however, this does not always occur.
CYL considers confidence in mineralisation continuity and distribution, as implied within the Mineral Resource estimate classification of Indicated and Inferred, is moderate, given the drill spacing described above and the patchy nature of mineralisation at Henty.
9. Estimation Methodology
The majority of mineralisation domains used in the MRE were manually constructed in Datamine software. The Z96 geological was constructed using LeapFrog software. Block modelling and grade interpolation were carried out using Surpac software. Statistical analysis was carried out using Snowden Supervisor software.
Block model constraints were created by applying the interpreted mineralised domain wireframes. Sub-celling in all domains was 0.625 m x 0.625 m x 0.625 m to accurately reflect the volumes of the interpreted wireframes.
All drillhole assay samples were uniquely flagged according to the mineralisation domains. All drillholes are composited to 1m downhole using a best-fit methodology and 0.5 m minimum threshold on inclusions. All DD, CH and SL samples were composited to 1m downhole using a best-fit methodology and 0.5 m minimum threshold on inclusions. A small of residual composites were retained in the estimation.
Henty gold mineralisation is hosted in multiple sub-parallel and sub-vertical tabular lenses ranging in strike length from a few tens of meters up to nearly 800m in length. The vertical extent of individual lenses can range from a few tens of meters to 270m vertically. The true width of the lenses ranges from 0.5m to >10m. The Henty March 2024 MRE incorporates the estimation of fifty-five individual mineralised lenses.
The distribution of gold grades within the mineralised lenses is highly variable and is characterised by distinct cohesive regions of higher tenor gold grades, with clusters of individual values often reaching several hundred grams per tonne. Whilst these higher-grade zones appear reasonably cohesive, they are manifested by a high-degree of short-scale variability, making difficult to manually interpret constraining domains. These internal; high-grade regions are often surrounded by peripheral regions of lower grade mineralisation that is also highly variable.
Raw Coefficients of Variation (CoV) are typically in the order of 1.5-3.5, indicating moderate to high grade variability. Some of the more substantial and higher-grade zones such as Z96 have CoV's of greater than 5.
The moderate to high grade variability and complex spatial continuity of high grades at Henty requires a pseudo non-linear approach to deal with these high grades during estimation. A traditional approach of physical domaining, assay cutting, and linear estimation (IDW or OK) is considered inadequate in dealing with this complexity.
The estimation method applied to most of the domains combines Categorical Indicator Kriging (CIK) to define internal estimation sub-domains domains, together with applying distance limiting at chosen grade thresholds to restrict the influence of the high grade and extreme grade values during grade interpolation.
Ordinary Kriging (OK) was used to directly estimate a small number of domains that were either poorly informed with data or where grade variability did not warrant a more sophisticated approach.
Table 2 summarises the estimation method applied to each mine area by estimation domain.
Table 2: Estimation Method – Domain Summary
Estimation Method | ||
Mine Area | CIK Domains | OK Domains |
Cradle Zone | 5201 | 5202 |
Darwin Central | 1401, 1402, 1403, 1404 | 1405 |
Darwin North | 1501, 1502, 1503, 1504, 1505 | |
Darwin South | 1101, 1102, 1103, 1104, 1105, 1106, 1108 | |
Intermediate Zone | 6101, 6102, 6103, 6104 | |
Newton Mt Julia | 2101, 2102, 2103, 2104, 2105, 2201, 2203, 2204, 2205 | |
Read Zone | 1301 | 1302, 1303, 1304, 1305 |
Sill Zone | 7101, 7102, 7103 | |
Tear Away | 1201, 1202, 1203 | |
Tyndall | 3101, 3102 | |
Z15 | 4101, 4102, 4103, 4104 | |
Z96 | 5101, 5102, 5103, 5104, 5105, 5106 | |
Total | 49 | 6 |
Prior to estimation, a reference surface for each estimation domain was exported from the Leapfrog . This is calculated as the best fit surface using the hangingwall and footwall surfaces. The reference surface is then imported into Surpac and a dip and dip-direction of each triangle facets is imported into the Surpac block model to provide information for dynamic search and variogram model orientation during interpolation. Dynamic estimation is applied for estimating the CIK indicators and gold grades.
Categorical Indicator Kriging Workflow
Two Categorical Indicator values are determined for the CIK domains:
- A low-grade (LG) indicator of 1.0 g/t Au was assigned to differentiate between background 'waste' and low-tenor mineralisation.
- A high-grade (HG) indicator of 5.0 g/t Au was assigned to define broad areas of consistent higher-tenor mineralisation.
Indicator variograms were modelled for the LG and HG thresholds for all mine areas. The indicator variograms for both grade thresholds exhibited a moderate nugget effect of between 20-30%. The LG indicator demonstrated well-structured average continuity of around 35m. The HG indicator demonstrated less well-structured average continuity of around 19m.
The CIK indicators were estimated using Ordinary Kriging into a finely gridded block model with block dimensions of 1.25m x 1.25m x 1.25m. The small block size for the indicator process is beneficial for creating categorical sub-domains at resolution which can be used to accurately back-flag composite data.
Three categorical sub-domains were generated: low-grade (LG), medium-grade (MG) and high-grade (HG) areas. The HG sub-domain was based on an indicator probability threshold of 0.35 and the LG sub-domain was based on an indicator probability threshold of 0.65. The MG sub-domain is assigned to blocks that do not satisfy either the HG or LG sub-domain criteria.
The three categorical block model sub-domains (HG, MG and LG) were used to 'back-flag' the 1m composites from each mine area, thus creating a separate composite file for each sub-domain.
Assay top-cuts are applied to the sub-domain composite files on a domain-by-domain basis and are typically in the following ranges:
HG = 15-300 g/t Au
MG = 5-50 g/t Au
LG = 2.5-5 g/t Au
The assay top-cuts were generally between the 97th to 99.9th percentile of the distribution and were aimed at globally limiting extreme values only. Top-cuts are not used as the primary tool to control metal risk. The use of grade thresholds and distance limiting is considered a more objective and influential method in controlling metal risk, while better reflecting the actual localised occurrence of discontinuous high-grade gold mineralisation.
Grade variograms were initially attempted separately for the LG, MG and HG sub-domains, however, this resulted in poorly structured and incoherent variograms. It was decided to use a variogram modelled on the combined grade data for each mine area. The combined grade variograms typically exhibited a moderate nugget effect of between 16% and 38% (average 31%) with a maximum range of continuity of between 21-45m (average 28m).
Grade thresholds for distance limiting were initially determined for each mine area from log-probability plots and visual inspection. Final distance limits were subsequently optimised following a detailed backward-looking mill reconciliation using mine stope voids for the period May 2023 to March 2023 (230Kt). The adjustment of grade distance limits was an iterative process until an acceptable reconciliation with the mill was achieved. The final applied grade distance limits are follows:
0-10 g/t = No Limit
10-25 g/t = 20m
25-50 g/t = 15m
>50 g/t = 7.5m
Prior to grade estimation, sub-domain codes from the 1.25m resolution block model are imported into a 2.5m x 2.5m x 2.5m resolution model and the proportion of LG, MG and HG is calculated for each 2.5m block. Grade estimation for the LG, MG and HG domains was undertaken in Surpac software using Ordinary Kriging with grade threshold distance limiting. Kriging Neighbourhood Analysis (KNA) was undertaken to assist with defining estimation parameters. Search routines and variogram orientations are drawn from the pre-populated dynamic search information recorded in each block.
Final block grades at a 2.5m x 2.5m x 2.5m block resolution were calculated by weighting the estimated grades for each sub-domain by the relevant domain proportion. The parent estimation block size was 2.5m x 2.5m x 2.5m. A minimum of 2 and maximum of 12 composites were used for each sub-domain estimate per block. It is possible that up to 36 composites can be used to estimate a parent block where there is a proportion of all three sub-domains present. Block discretisation was set at 3 E x 3 N x 3 RL points (per parent block). A standardised single pass search distance of 40-60m was used. Octant restrictions were not used. Data spacing varied from <10m x 10m to 40m x 20m.
Model validation was completed to check that the grade estimates within the model were an appropriate reflection of the underlying composite sample data, and to confirm that the interpolation parameters were applied as intended. Checks of the estimated block grade with the corresponding composite dataset were completed using several approaches involving both numerical and spatial aspects as follows:
- Semi-Local: Using swath plots in X, Y and Z directions comparing the estimates to the sample data.
- Local: Visual inspection of the estimated block grades viewed in conjunction with the sample data.
Ordinary Kriging Workflow
Ordinary Kriging (OK) was used to directly estimate six domains that were either poorly informed with data or where grade variability did not warrant a more sophisticated approach.
All DD, CH and SL samples were composited to 1m downhole using a best-fit methodology and 0.5 m minimum threshold on inclusions. A small number of residual composites were retained in the estimation.
Composite files were statistically analysed in Supervisor software, with assay top cuts defined. Top cuts of between 7.5-15 g/t were applied to the data to control the effects of outlier high grade Au values that were considered not representative. The effect of the top cuts was reviewed with respect to the resulting Mean and CV values.
Kriging Neighbourhood Analysis was undertaken to assess the effect of changing key kriging neighbourhood parameters on block grade estimates. Kriging efficiency and slope of regression were determined for a range of block sizes, minimum/maximum samples, search dimensions and discretisation grids. Variograms were generated using composited top-cut drill data in Snowden Supervisor v8 software.
Within each domain, an Ordinary Kriging estimate of gold grade was produced using the cut composite data. A standardised single pass search distance of 60m was used. Octant restrictions were not used. Hard boundaries were used for the estimate.
To enable the use of dynamic variograms and search orientations during the estimation of gold, the reference surfaces for each domain were exported from the Leapfrog project. This is calculated as the best fit surface using the hanging wall and footwall surfaces.
A minimum of 2 and maximum of 12 (1 m composite) samples per block were used with no limit of samples per drillhole. The minimums and maximums were established through independent KNA on each major domain. Block discretisation was set at 3 E x 3 N x 3 RL points (per parent block).
Octant restrictions were not used, and estimates were into parent blocks, not sub-blocks.
Drill spacing was approximately 20m by 20m or closer. Block dimensions were 2.5m x 2.5m x 2.5m (XYZ).
Model validation was completed to check that the grade estimates within the model were an appropriate reflection of the underlying composite sample data, and to confirm that the interpolation parameters were applied as intended. Checks of the estimated block grade with the corresponding composite dataset were completed using several approaches involving both numerical and spatial aspects as follows:
- Semi-Local: Using swath plots in Northing and RL comparing the estimates to the sample data.
- Local: Visual inspection of the estimated block grades viewed in conjunction with the sample data.
10. Bulk Density
CSA Global in 2023 were supplied 5,096 "Weight Wet" and "Weight Dry" records determined from 1,662 individual drillholes via the Archimedes (water immersion) method. Density was calculated from the data by the following equation:
Density= (Weight Air)/ (Weight Air-Weight Water)
The available density data was selected from within the mineralised zone interpretations for the various model areas. Outlier samples were removed from the data selected and a global average of density was calculated. A value of 2.8 t/m3 was determined, which has been applied directly to the model cells for all block model areas. No new density data was available for the 2024 MRE.
11. Classification Criteria
Mineral Resources were classified as Indicated and Inferred to appropriately represent confidence and risk with respect to data quality, drill hole spacing, geological and grade continuity and mineralisation volumes. Additional considerations were the stage of project assessment, current understanding of mineralisation controls and mining selectivity within an underground mining environment.
The drilling, surveying and sampling undertaken, and analytical methods and quality controls used, are appropriate for the style of deposit under consideration.
Indicated Mineral Resources were defined where a moderate level of geological confidence in geometry, continuity and grade was demonstrated, and were identified as areas where:
- The portions of the Henty Gold Mine 2024 MRE classified as Indicated have been flagged in areas of the model where average drill hole spacing is 20m x 20m or closer. The drill spacing within the Indicated portion of the resource is appropriate for defining the continuity and volume of the mineralised domains, at a nominal 20 m drill spacing on 20 m sections.
- Blocks were interpolated with a neighbourhood largely informed by the maximum number of samples.
Inferred Mineral Resources were defined where a low to moderate level of geological confidence in geometry, continuity and grade was demonstrated, and were identified as areas where:
- Drill spacing averaged a nominal 40 m or less, or where drilling was within 40 m of the block estimate.
Further considerations of resource classification include; data type and quality (drilling type, drilling orientations, down hole surveys, sampling and assaying methods); geological mapping and understanding; statistical performance including number of samples, slope regression and kriging efficiency.
Mineralisation within the model which did not satisfy the criteria for classification as Mineral Resources remained unclassified.
The delineation of Indicated and Inferred Mineral Resources appropriately reflects the Competent Person's view on continuity and risk at the deposit.
12. Cut-off Grade
The Henty underground Mineral Resources is reported at a cut-off grade of 1.5 g/t Au. The cut-off grade has been derived from current mining and processing costs and metallurgical parameters. Inputs into the cut-off grade calculation include:
- Mining Fixed and Variable = AUD$66/t
- Grade Control = AUD$12/t ore
- Processing Costs = AUD$28/t ore
- Maintenance Costs = AUD$43/t ore
- Metallurgical Recovery = 92%
- Royalties = 5.9%
- Gold Price = AUD$3,500/oz
In addition to applying a cut-off grade of 1.5 g/t Au, the Mineral Resource has been reported within an underground Shape Optimiser (SO) evaluation from the undiluted and depleted resource model. SO input parameters include a minimum mining width of 1.5m, minimum stope length of 5m, stope height of 16m.
13. Assessment of Reasonable Prospects for Eventual Economic Extraction
The Henty Gold Mine Mineral Resource (MRE) has been undertaken with a focus on delineating areas of the MRE with Reasonable Prospects for Eventual Economic Extraction (RPEEE) by underground mining methods. The MRE has been constrained within an underground Shape Optimiser (SO) evaluation from the depleted resource model that contains 75% or greater of its volume as in-situ material.
SO input parameters include a 1.5 g/t Au cut-off, minimum mining width of 1.5m minimum stope length of 5m, stope height of 16m. The orientation of SO's is variable depending on the geometry of the mineralisation resource model.
The Mineral Resource is considered to have reasonable prospects for eventual economic extraction (RPEEE) given the access to critical infrastructure, the volume and grade of mineralisation available for mining and the RPEEE criteria which have been applied prior to reporting the Mineral Resource.
14. Mining and Depletion
Underground mining at Henty has taken place since 1996. Mining depletion to January 31, 2024, was applied to the model.
No dilution or cost factors were applied to the estimate.
15. Metallurgy
Henty is an operating mine and there are no material metallurgical issues that are known to exist.
No metallurgical recovery factors were applied to the Mineral Resources or resource tabulations.
This announcement has been approved for release by the Board of Directors of Catalyst Metals Limited.
Competent person's statement
The information in the report to which this Mineral Resource Statement is attached that relates to the estimation and reporting of gold Mineral Resources at the Henty Gold Mine is based on information compiled by Mr Andrew Finch, BSc, a Competent Person who is a current Member of Australian Institute of Geoscientists (MAIG 3827). Mr Finch, Geology Manager, at Catalyst Metals Ltd has sufficient experience relevant to the style of mineralisation and deposit type under consideration and to the activities being undertaken to qualify as a Competent Person as defined in the 2012 Edition of the Australasian Code for Reporting of Exploration Results, Mineral Resources and Ore Reserves. Mr Finch consents to the inclusion in the report of matters based on his information in the form and context in which it appears.
The information in this report that relates to Ore Reserves is based on and fairly represents information and supporting documentation compiled by Anthony Buckingham BEng (Mining Engineering), a Competent Person who is a member of the Australasian Institute of Mining and Metallurgy (AUSIMM). Anthony Buckingham is a full-time employee of Catalyst Metals. He is a shareholder in Catalyst Metals and is entitled to participate in the Catalyst Performance Rights Plan.
Anthony Buckingham has sufficient experience that is relevant to the style of mineralisation and type of deposit under consideration and to the activity being undertaken to qualify as a Competent Person as defined in the 2012 Edition of the Australasian Code for Reporting of Exploration Results, Mineral Resources and Ore Reserves (JORC 2012).
Anthony Buckingham consents to the inclusion in the report of the matters based on his information in the form and context in which they are presented. This Ore Reserve estimate has been compiled in accordance with the guidelines defined in the 2012 Edition of the Australasian Code for Reporting of Exploration Results, Mineral Resources and Ore Reserves (JORC 2012).
The information in this presentation to which this Exploration Target relates is based on information compiled by Mr Andrew Finch, BSc, a Competent Person who is a current Member of Australian Institute of Geoscientists (MAIG 3827). Mr Finch, Geology Manager, at Catalyst Metals Ltd has sufficient experience relevant to the style of mineralisation and deposit type under consideration and to the activities being undertaken to qualify as a Competent Person as defined in the 2012 Edition of the Australasian Code for Reporting of Exploration Results, Mineral Resources and Ore Reserves. Mr Finch consents to the inclusion in the report of matters based on his information in the form and context in which it appears.
JORC 2012 Mineral Resources and Reserves
Catalyst confirms that it is not aware of any new information or data that materially affects the information included in the original market announcements and that all material assumptions and technical parameters underpinning the estimates in the relevant market announcements continue to apply and have not materially changed. The Company confirms that the form and context in which the Competent Persons findings are presented have not been materially modified from the original market announcements.
APPENDIX 1
PLUTONIC UNDERGROUND – JORC CODE, 2012 EDITION – TABLE 1
Section 1 Sampling Techniques and Data
Plutonic Underground Deposit
(Criteria in this section apply to all succeeding sections.)
Criteria | Commentary |
Sampling techniques |
|
Drilling techniques |
|
Drill sample recovery |
|
Logging |
|
Sub-sampling techniques and sample preparation |
|
Quality of assay data and laboratory tests |
|
Verification of sampling and assaying |
|
Location of data points |
|
Data spacing and distribution |
|
Orientation of data in relation to geological structure |
|
Sample security |
|
Audits or reviews |
|
Section 2 Reporting of Exploration Results
Plutonic Underground Deposit
(Criteria listed in the preceding section also apply to this section.)
Criteria | Commentary |
Mineral tenement and land tenure status |
|
Exploration done by other parties |
|
Geology |
|
Drill hole Information |
|
Data aggregation methods |
|
Relationship between mineralisation widths and intercept lengths |
|
Diagrams |
|
Balanced reporting |
|
Other substantive exploration data |
|
Further work |
|
Section 3 Estimation and Reporting of Mineral Resources
Plutonic Underground Deposit
(Criteria listed in section 1, and where relevant in section 2, also apply to this section.)
Criteria | Commentary |
Database integrity |
Surface and underground drill hole and face data is validated to produce a digital database free of detected errors. This is undertaken by passing data through embedded macros and queries of the drill hole database software by table (collar, assay, lithology, survey, and grout). Crosschecks are also undertaken to ensure that each drill hole has data from collar, assays, lithology, survey, and grout files. By undertaking the above procedures, all drill hole and face data is rigorously checked, verified, and corrected where necessary to ensure limited failures. |
Site visits |
|
Geological interpretation |
|
Dimensions |
Timor Pacific A134 Cortez Baltic Caribbean Indian Caspian |
Estimation and modelling techniques |
HG = 300 g/t Au MG = 40 g/t Au LG = 20 g/t Au
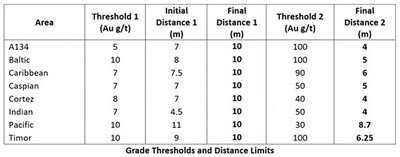
|
Moisture |
|
Cut-off parameters |
|
Mining factors or assumptions |
|
Metallurgical factors or assumptions |
|
Environmental factors or assumptions |
|
Bulk density |
|